Want to reduce your operating costs and get hugely improved reliability at your plant? Pay attention to this one thing.
/by John Tonkin
It's not flashy, but a careful study of system curves is going to help you realise savings that are out of all proportion to the input costs.
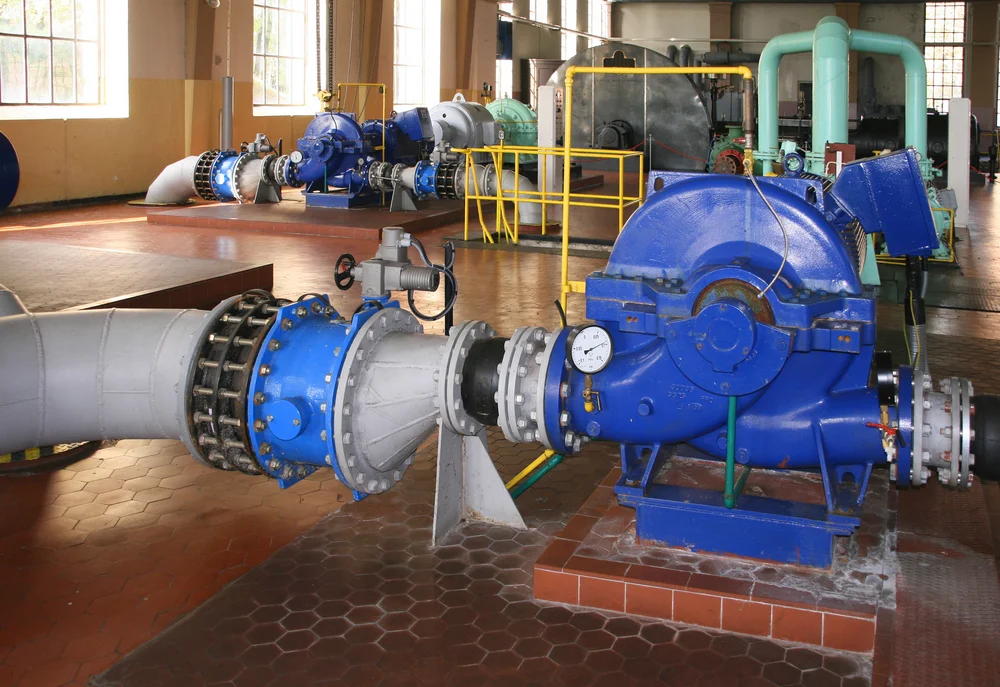
During a recent energy audit of a river pump station, the vital importance of system curves was clearly demonstrated.
This station had three 600kW units. Designed and installed in the early part of the nineteen fifties, the pumps and one of the motors were on the wrong end of sixty years old!
Curves? None. Original Manufacturer? Untraceable. Controls? Variable speed using banks of resistors. Pure 1950's technology.
What were the positives?
There was a flow meter that had recently been calibrated.
A calibrated pressure gauge was fitted to the discharge manifold (after the first one was taken off the pipe and continued to read 4,5bar!).
The height between the river and the discharge gauge could be measured (12m).
As the plant was operating at reduced capacity and there was a large capacity reservoir at the end of the discharge pipeline (1,2kms), the pumps could be switched off for a period of time in order to ascertain the static head between the discharge gauge and the outlet.
There was a brass plate on the side of each pump that gave three duty points on the (original) performance curve - not much for 64-year-old pumps, but it was something.
A power meter had been fitted to one of the pumps.
A thought here. How much does a panel-mount power meter cost? I purchased one for R1500, as well as data logging software, for R1800. This is a fraction of the system capital and energy costs associated with all but the smallest pump systems. What is the value of the information given by these meters? Priceless!
So we set to work
We ran one pump at four different speeds, and took flow, head and power readings. Ran two pumps at two different speeds, ran all three pumps at four different speeds and took the same readings.
The data were plotted and the picture that emerged was a source of excitement. Even after many years and many installations, there is a great feeling of accomplishment as the points appear on the grid.
The System Head Curve
Have a look at the curve below. This is how the raw data presented itself. The resulting System Head Curve (curve of best fit) clearly shows the relationship between pumps and pipeline.
From the diagram, it becomes immediately apparent that this station was designed for a two-operating-one-standby configuration. For various reasons, they were operated virtually continuously in an all-three-operating manner.
Even in a new condition, the duty point would move far to the left of each of the three pump's curve i.e. 59m. At 59m, pump curve one shows that each pump will "see" 2300m3/hr. This is quite well left on the curve(s).
What would happen if the (estimated) dashed sections of the curves were flatter? The duty point would move even further left with all the attendant problems that a “choked” duty point creates. If the pumps were to wear and by default, have their curves move downwards (as would happen, as their performance deteriorated over the years) then the duty points would move even further left. The situation can only deteriorate. Efficiency would decline and a host of other LHS problems could arrive to make life even more difficult.
It's worth mentioning that the 900mm steel cement mortar lined pipeline is the original, except for one length that was damaged and replaced.
The system head curve for an equivalent pipeline in new condition was drawn using as-new data. The variations between the two curves were no more than 2% at any point. Not at all bad for a 64-year-old pipeline.
If the system curve and supporting data are matched with the power absorbed readings, then a potentially exciting business opportunity comes to light.
Running two pumps at speed 6 versus running three pumps at lower speeds brought about pump efficiency improvements of between 15 and 18 percentage points. In CO2 terms, this meant a reduction of 6800 tonnes per annum. In money terms, the potential savings were nothing short of remarkable.
Reduce operating costs and improve plant reliability
The best part of this entire process was being able to graphically show how some significant savings could be gained by applying a few basic changes to the way the existing pumps are operated.
Some basic training and a works procedure would bring significant reductions in operating costs to the table.
If there was a willingness to spend some money and replace only the pump ends, the savings would nearly triple.
Changing everything, including the motors and controls would bring about a lot more clarity with regard to the actual performance of all the equipment in the station and an even greater level of saving. This was a much bigger project and would require a far more detailed study.
Once again, the power of an accurate System Curve showing the performance of an operating system was highlighted in the clearest way possible.
This article was originally published on the John Tonkin and Associates website.


