
Making cents of a borehole installation
/John Tonkin
Money’s too tight to mention, so the song goes.
Another one says, “I’m another day older and deeper in debt.”
Sound familiar? Well, the fact is that you could be unnecessarily sinking money into your borehole installation. In this article, at some of the cost dynamics of a groundwater system and what can be done optimise returns.
Energy costs are the biggest factor

Figure 1: Life Cycle Costs for a groundwater system
When it comes to purchasing anything, the easiest thing to do is to get caught up in the material, touch-and-feel aspects of the transaction. In the case of a borehole, there is a tendency to focus on the pump, pipes and control systems from a capital cost point of view. How much is the installation going to cost? To get a true answer, we have to look beyond the capital costs and look at the installation from a life cycle cost point of view.
The pie chart in Figure 1 shows that energy makes up more than half of the costs of owning a borehole. What the buyer takes out their pocket to pay for the complete installation will be a relatively small percentage of what the total cost will be over the installation’s life cycle. In other words, the real sting comes after the borehole has been installed.
There is an additional cash consideration and that is the rate of inflation in the energy sector. Any abnormal increase in electricity prices will make the energy segment of the pie grow bigger. Let’s look at what has been happening in South Africa over the past few years.
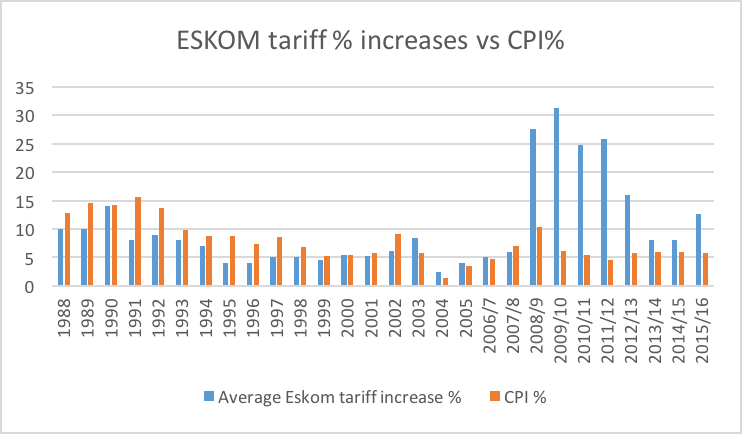
Figure 2: ESKOM tariff percentage increases vs CPI percentage increases (view source)
Figure 2 represents a situation of exploding demand meeting constrained supply. The reasons for this state of affairs has been widely documented and is beyond the scope of this article. In a nutshell, the figures show that R1 worth of energy in the year 2000 should cost R2,45 in 2016 according to the published Consumer Price Index (CPI) figures. The ACTUAL cost of the same amount of energy in 2016 is R6,08, nearly 2,5 times higher than CPI.
From all of these figures, we are going to have to carefully consider how much energy/money is required to extract each unit (cubic metre) of water from the borehole. After all it's the water that is the desired end result.
The greater the drawdown, the poorer the flow rate, the more you are paying
Let’s take a typical scenario from the groundwater industry. Figure 3 shows the construction details for a borehole. Figure 4 represents the performance curve for the pump that was selected and installed. Superimposed on the pump curve are the three system head curves that represent respectively:
- Operating conditions at static water level: Duty 1
- Operating conditions at 2/3 of the available drawdown: Duty 2
- Operating conditions at maximum drawdown: Duty 3
Figure 3: Borehole construction
Figure 4: Pump performance and system curves
It is common in the pump industry to select pumps based on a “duty point”. In the vast majority of applications, the conditions under which a pump has to operate vary to a greater or lesser degree. A better way of approaching the cost effective selection and operation of a pump installation is to recognise that there is no such thing as a duty point but rather a duty range. Borehole pumps are a definitive example of this situation.
Figure 4 shows that as the pump start button was pressed, the flow rate was 62m3/hr (total static head 10m + 13m). As water was pumped out of the hole, the level started dropping until it stabilised at a flow rate of 41m3/hr. The water level at this point has fallen to about 42m (total static head will be 42m + 13). Assume that the figures were obtained in a “wet” season” i.e. when there was sufficient rain to recharge the water taken from the ground.
In a drought situation (and don’t we know about that now!) the level could continue falling to the 60m mark (total static head will be 60m + 13m). The flow under these conditions would decline to about 18,5m3/hr.
Lets’ look at what this means to us in money terms.
The monetary implications of running a borehole
| Duty | Total Static | Friction Losses | Total Dynamic Head (m) | Flow (m3/hr) | Pump Efficiency | kW Absorbed (kW) | Volume per energy unit (m3/kWhr) | % Change in volume per energy unit |
|---|---|---|---|---|---|---|---|---|
| 1 | 23 | 6 | 29 | 62 | 64% | 7,5 | 8,3 | |
| 2 | 55 | 1 | 56 | 41 | 74% | 8,5 | 4,8 | -42% |
| 3 | 73 | 0,5 | 74 | 18,5 | 50% | 7,4 | 2,5 | -60% |
Energy being the major cost in the operation of a borehole installation, and the objective being to get as much water as possible for the lowest cost, we need to take heed of the figures given in the table above.
For each of the draw down levels, the amount of power required to lift water out of the hole has been calculated (kW absorbed). Next, the amount of water delivered for each unit of energy consumed (m3/kWhr) has been calculated by dividing the flow rate (m3/hr) by the kW absorbed.
So… If we want to achieve the milestone of another day older (there’s no escape here) but in less debt, then the question has to be posed “How many cubic metres of water did I get for the kilowatt hours I paid for?”
The table shows that when the start button was pressed and the water came rushing out (62 000 litres every hour!) we got 8,3 cubic metres for every kWhr of energy paid for.
As the water level moved lower, the pump became more efficient but the flow rate declined to 41 cubic metres per hour and the water had to be lifted much higher (56m). Most of the energy paid for was used to lift the water the extra height. The result? We got 42% less water for the same energy input.
What happens if the pump manages to drop the water down to the lowest level? Simply put, the water to energy ratio drops to 2,5m3/kWhr. This represents an increase of 60% in the cost of water pumped.
Manage water levels in the borehole for optimal returns
Water levels that move downwards in boreholes are a fact of life. The point being made is that if the drop in water levels can be minimised and optimised through sound water (resource) management, costs will be lower and returns will be maximised.
In addition to the cost savings, there are a number of other benefits associated with the management of water extracted from a borehole.
- Less stress on the borehole, due to lower flow velocities.
- Higher reliability and continuity of supply from the aquifer.
- A far greater opportunity to optimise the efficiency and effectiveness of the pump.
- Optimisation of the pump brings with it significant reductions in maintenance costs.
Money money money, must be funny in a rich man’s world. It appears that Abba had a good insight into the dynamic of minimising inputs while maximising outputs.

